 This month, Bloomberg Business released two articles* on the state of manufacturing in the U.S. based on October reports.
The headlines read:
“Manufacturing in U.S. Stagnated in October on Weak Exports”
“Manufacturing in U.S. Climbs for First Time in Three Months”
Looking at these headlines, it’s hard to draw a conclusion. And therein lies a uniquely modern challenge: How do we use data to draw meaningful insights?
Let’s go through steps to get the most out of your data.
1. Decide what measures to look at.
The Bloomberg articles were each based on a different index.
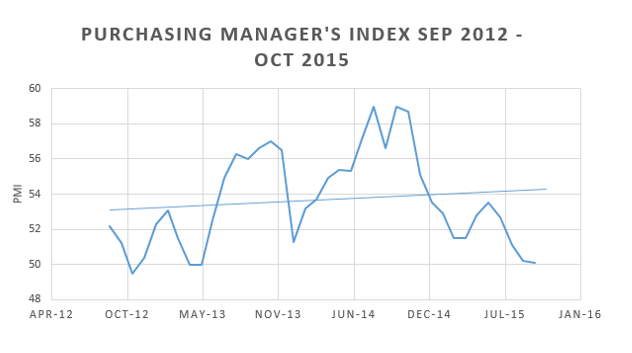
The first, less optimistic article, is based on the Institute for Supply Management (ISM) Purchasing Managers Index (PMI) which is released at the start of each month. For the month of October, the ISM reported a PMI of 50.1, the lowest this measure has been since 2013. A score under 50 signals industrywide contraction.
The second Bloomberg article drew insight from the Industrial Production Index, which is published mid-month by the U.S. Federal Reserve. In October of 2015 Manufacturing Production increased 0.4 percent, while overall Industrial production fell 0.2 percent.
The ISM’s PMI and the U.S. Federal Reserve’s Industrial Production Index are both considered reliable data sources. Let’s take a look at why.
2. Understand what's being measured.
What does the PMI measure?
Economic health of the manufacturing sector.
PMI is based on the following indicators:
- Production levels
- New orders
- Supplier deliveries
- Inventory levels
- Employment levels
What does the Industrial Production Index (IPI) measure?
Output of manufacturing, mining and electric gas utility establishments located in the U.S. Results are segmented so that conclusions can be drawn about each industry, on an individual basis.
IPI is based on the following indicators:
- Output in the form of physical units produced
- Nominal output divided by the Fisher Price Index which takes into account the market value of goods
A comparison of these two measures can tell us that the PMI is a broader measure that accounts for many factors including employment, while the IPI is more narrowly focused on output.
3. Look at Trends.
Looking at the PMI and IPI starting in September of 2011 until now, we can see that manufacturing production in the U.S. follows an up and down pattern. Dan Meckstroth, VP and Chief Economist at the Manufacturers Alliance for Productivity and Innovation notes that this pattern indicates slow growth.

Day-to-day, report-to-report is no way to live. Data provides insight, but we must take a step back and look at the big picture so as not to be swayed by every change that occurs. This is especially true when we have access to real-time data. Building an understanding of norms allows us to note when uncharacteristic or drastic changes do occur in the moment, or in the case of the overall health of the manufacturing industry as measured by PMI and IPI, from one month to the next.
4. Relate what the data shows to your business.
- Frequent ups and downs are part of an overall slow growth pattern in U.S. manufacturing. Aware of this trend, we can remain unruffled by month-to-month fluctuation and avoid the trap of changing our entire outlook on the industry every time a new report is released.
- The IPI as a measure of manufacturing output was up in the month of October. The PMI, which takes into account a broader set of variables (including inventory levels, employment levels and new orders) was down for the month of October. The assertion of manufacturing health varies depending on what is being measured. You can and should consider which measures matter most to you.
- In a volatile market, it is important to look to your own performance. How were your output, inventory and employment levels last month? Did they meet the level needed for personal success? How did your performance compare to industry-wide captures? These are questions that can drive meaningful insight.

Industries change, technology evolves and your data …grows. According to IBM, 2.5 quintillion bytes of data are created every day. And that’s (literally) not the half of it. The Economist reports the volume of data being stored doubles every 18 months. “We have more data than ever before” is a statement that continually rings true.
Having the most data is not equal to having the most insight. Getting the most out of your data, now that’s smart.
*Bloomberg Business articles from Nov 2, 2015 and Nov 17, 2015.


